Key Takeaways
- Ethereum faces a critical price resistance at the $4,800 level, an on-chain “final boss” with billions in stacked sell orders.
- The market saw a cooling of bullish sentiment following the first daily net outflow for U.S. Spot Ethereum ETFs, breaking a significant eight-day streak.
- While a bullish breakout could lead to new all-time highs, technical analysis suggests a possible retracement of over 20% to the $3,375 support level.
As a new week unfolds, the Ethereum market is at a pivotal crossroads, grappling with competing narratives of a monumental breakout and a sharp bearish retracement.
On one side, a towering sell wall at $4,800 presents a formidable challenge, a “final boss” that could either cap its recent rally or, if breached, unleash a new parabolic run.
On the other, the recent daily outflows from Spot Ethereum ETFs have signaled a potential cooling of institutional enthusiasm, adding a layer of caution to the market.
The $4,800 “Final Boss”
The most critical factor for Ethereum’s near-term trajectory is the massive concentration of sell orders clustered around the $4,800 mark.
Described by analyst Merlijn The Trader as a “final boss,” this level represents a colossal sell wall on major exchanges. Liquidity heatmaps confirm a staggering amount of asks—or sell orders—stacked in this zone, forming a dense resistance fortress.
A successful push above this level would require overwhelming buy volume, as it would not only signify a technical breakout but also a powerful psychological victory.
Clearing this barrier could trigger a short squeeze, liquidating the billions of dollars in short positions set just above this price, and potentially open “blue skies” for Ethereum, allowing its price to enter a new discovery phase and target new all-time highs.
Bearish Retracement Scenario
Despite the promising outlook of a bullish breakout, a competing analysis from TradingView paints a more cautious picture.
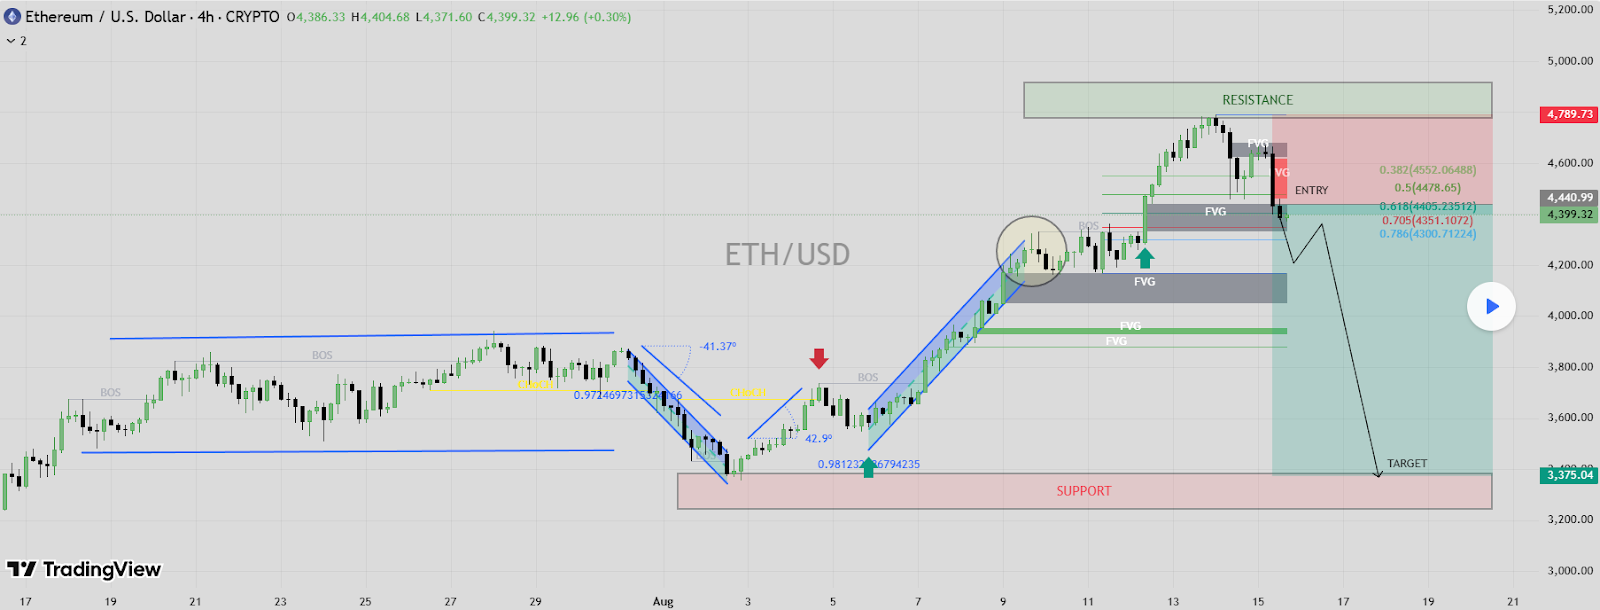
This technical assessment, based on the 4-hour candlestick timeframe, confirms the $4,700 to $4,800 region as a supply-heavy resistance zone where Ethereum has already shown signs of exhaustion, collectively suggesting that Ethereum may be due for a corrective move.
The market is currently in a state of high tension, with both a powerful liquidity-driven breakout and a sharp technical retracement scenario hanging in the balance.
Final Thoughts
Ethereum’s current position is a high-stakes standoff. The outcome hinges on which force proves stronger: the institutional buying power needed to smash through the $4,800 sell wall, or the technical and psychological resistance that could trigger a deep retracement. Investors should watch ETF flows closely and monitor the price action around key support and resistance levels.
Frequently Asked Questions
What is a “liquidity zone” or “sell wall”?
A “sell wall” is a specific type of liquidity zone where a large volume of sell orders is stacked at a particular price, creating significant resistance for the price to move higher.
What are Spot Ethereum ETFs?
An exchange-traded fund that invests directly in Ethereum. On July 23, 2024, the SEC allowed the first spot Ethereum ETFs to start trading following the approval of spot Bitcoin ETFs in January 2024.
What happens if Ethereum breaks above $4,800?
It could trigger a short squeeze, causing the price to rise rapidly as short-sellers are forced to buy back their positions, potentially pushing Ethereum toward new all-time highs.